PCL-04 Peripheral
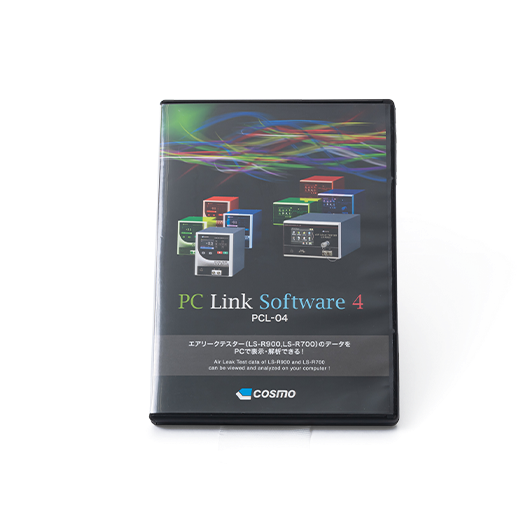
- PC Link Software 4
- This application software can obtain leak test data in Excel or CSV format.
Files can be automatically generated on a daily or hourly basis, and data can be automatically acquired even on the lines operating 24 hours a day.
Tester parameters can be saved to files and managed on a PC. It is very useful for replacing the testers.
Basic Specs.
| PC |
Windows running computers
|
|---|---|
| OS | Windows XP(SP3), Windows 7, Windows 8.0/8.1, Windows 10, Windows 11 |
| Excel version | Excel 2000, Excel 2003, Excel 2007, Excel 2010, Excel 2013 (Excel required) |
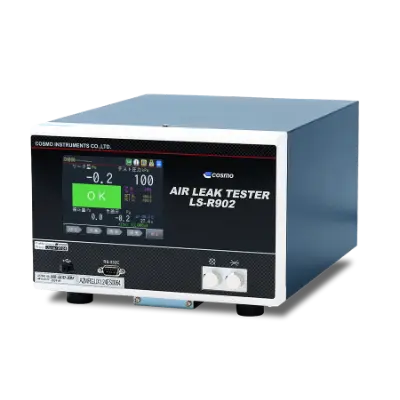
| Leak Tester | LS-R900, LS-R902, LS-R910, LS-R912, LS-R700, LS-1842, LS-1822A, LS-1813 |
| Communication |
RS-232C
|
| Communication cable (Sold separately) |
RS-232C cross (reverse) cable
|
| License |
A license is assigned per one CD-ROM to which the software is officially supplied. The software must be purchased for the number of computers on which the software will be used. Contact us for license certificate issuance and multiple licenses. |
| Parameter setting feature | Loading leak tester parameters, Editing test parameters, Sending updated test parameters to leak tester, Basic Parameters display, All Parameters display, Custom display, Saving a set of test parameters as a file, Loading saved test parameter files, Custom View setting, Channel Copy (Copy 1, Copy 2), Reloading leak tester parameters, Collation of leak tester parameters and current parameters, Print preview, Print settings and Print |
| Data acquisition feature (EXCEL format) |
Data acquisition as number, Data acquisition as text, Selecting test data format, Notes (Saved with the data), Start/Stop Air Leak Tester, Graph spreadsheet (X charts), Standard Deviation spreadsheet (Histograms), Recording Data receipt date and time |
| Data acquisition feature (CSV format) |
Selecting test data format, Setting destination folder, Setting file name index, Setting time to create file (Time1, Time2, Time3), REC (record) / PAUSE (pause) / STOP (stop) buttons, Displaying current status, Start/Stop leak tester |
| Waveform display feature | Live waveform display, Start/Stop Air Leak Tester, Changing graph scale, Layer display (Graph1, Graph2, Graph3), Stop/Resume data receipt with the Pause button, Display of Stage symbols and Stage lines in the waveform display, Saving received test data in Excel, Saving graphs as an image (BMP/PNG/GIF/JPG), Saving and loading data files |
Features / Functions
Features
-
Test parameters editing and storing
→ Test parameters can be viewed and managed on a computer. -
Test logs are acquired in Excel or CSV format.
→ Test data analysis is available. -
Different sets of test data can be displayed in waveforms, which can be compared with each other.
→ Helps determine an optimum test conditions. - Acquired data can be stored in files and printed out.
-
Multi-language (Japanese, English, Korean, Chinese)
→ This software can be used in overseas plants.
Use Example
- Test data analysis using Excel.
-
Collect data on all products produced on the line.
→ Test log of all products is kept. -
Create test parameter files by work type.
→ Test parameters can be managed in files on computers. -
Program test parameters for the replacing tester.
→ Set up the replacing tester quickly.
Parameter Settings

- Test parameters can be loaded from the leak tester and edited and saved on a computer.
- Parameters on the left side of the screen can be edited and those on the right side are the current parameters. The settings can be edited by viewing both.
- Parameters saved on files can be loaded and edited again.
- “Basic Parameters”, “All Parameters” and “Custom” screens are available. In the “Custom” screen, the parameters to be displayed can be selected.
- Test parameters of the selected channels can be printed out. A set of test parameters of a channel is printed out on an A4 paper.
Data Acquisition

-
Data acquisition in Excel format
- Test data are automatically output into Excel files.
- An X-chart is displayed in the Graph spreadsheet, and histograms are displayed in the Standard Deviation spreadsheet.
-
Data acquisition in CSV format
- Test data is recorded live for CSV format. CSV data acquisition is useful for long-term automatic data collection.
- A new file will be automatically generated up to every 24 hours. Up to 3 files per day can be generated automatically with time settings.
Waveform

- Test data are displayed in waveforms live.
- Up to two sets of waveforms (e.g. Leak and Test Pressure) can be graphically recorded
- Up to three sets of layers of waveforms can be viewed at the same time for comparison.
- Waveform data can be saved in files.
- Stage symbols such as CHG (Pressurization), BAL2 (Stabilization) and DET (Detection) are also displayed on the waveform display.
- Waveforms can be saved as an image which is useful for documentation.
Documents
- * Please fill out the form to download.
